Daru: Pandas for Ruby

Photo by Bruce Hong
2023 Update: Check out Polars Ruby as well.
NumPy and Pandas are two extremely popular libraries for machine learning in Python. Last post, we looked at Numo, a Ruby library similar to NumPy. As luck would have it, there’s a library similar to Pandas as well. It’s called Daru, and it’s the focus of this post.
Overview
Daru is a data analysis library. Its core data structure is the data frame, which is similar to an in-memory database table. Data frames have rows and columns, and each column has a specific data type. Let’s create a data frame with the most populous countries:
df = Daru::DataFrame.new(
  country: ["China", "India", "USA"],
  population: [1433, 1366, 329] # in millions
)
Population data from the United Nations, 2019
Here’s what it looks like:
     country population
0      China       1433
1      India       1366
2        USA        329
You can get specific columns with:
df[:country]
df[:country, :population]
Or specific rows with:
df.first(2)  # first 2 rows
df.last(2)   # last 2 rows
df.row[1]    # 2nd row
df.row[1..2] # 2nd and 3rd row
Filtering, Sorting, and Grouping
Select countries with over 1 billion people.
df.where(df[:population] > 1000)
For equality, use eq or in.
df.where(df[:country].eq("China"))
df.where(df[:country].in(["USA", "India"]))
Negate a condition with !.
df.where(!df[:country].eq("India"))
Combine operators with & (and) and | (or).
df.where(df[:country].eq("USA") | (df[:population] < 1400))
Sort the data frame by a column with:
df.sort([:population])
df.sort([:country], ascending: [false])
You can also group data and perform aggregations.
cities = Daru::DataFrame.new(
  country: ["China", "China", "India"],
  city: ["Shanghai", "Beijing", "Mumbai"]
)
cities.group_by([:country]).count
Combining Data Frames
There are a number of ways to combine data frames. You can add rows:
countries = Daru::DataFrame.new(
  country: ["Indonesia", "Pakistan"],
  population: [271, 217] # in millions
)
df.concat(countries)
Or add columns:
locations = Daru::DataFrame.new(
  continent: ["Asia", "Asia", "North America"],
  planet: ["Earth", "Earth", "Earth"]
)
df.merge(locations)
You can also perform joins like in SQL.
cities = Daru::DataFrame.new(
  country: ["China", "China", "India"],
  city: ["Shanghai", "Beijing", "Mumbai"]
)
df.join(cities, how: :inner, on: [:country])
Reading and Writing Data
Daru makes it easy to load data from a CSV file.
Daru::DataFrame.from_csv("countries.csv")
After manipulating the data, you can save it back to a CSV file.
df.write_csv("countries_v2.csv")
You can also load data directly from Active Record.
relation = Country.where("population > 100")
Daru::DataFrame.from_activerecord(relation)
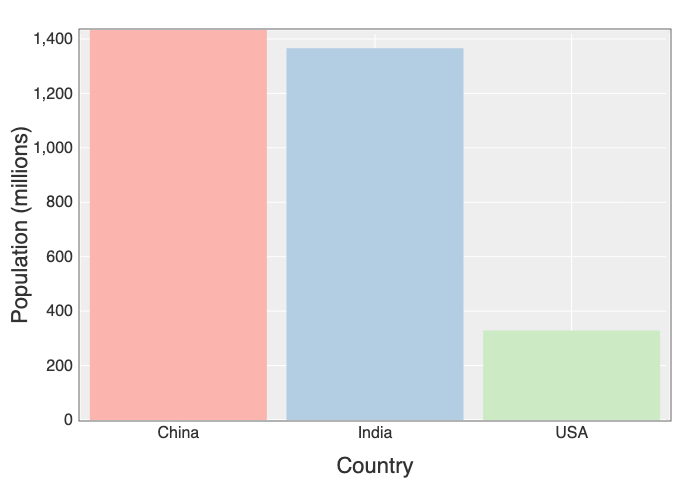
Plotting
For plotting, use a Jupyter notebook with IRuby. Create a plot with:
df.plot type: :bar, x: :country, y: :population do |plot, diagram|
  plot.x_label "Country"
  plot.y_label "Population (millions)"
  diagram.color(Nyaplot::Colors.Pastel1)
end
You can also create line charts, scatter plots, box plots, and histograms.
Summary
You’ve now seen how to use Daru to:
- create data frames
- filter, sort, and group data
- combine data frames
- create plots
Try out Daru for your next analysis.