PgHero 2.0 Has Arrived
It’s been over 2 years since PgHero 1.0 was released as a performance dashboard for Postgres. Since then, a number of new features have been added.
- checks for serious issues like transaction ID wraparound and integer overflow
- the ability to capture and view query stats over time
- suggested indexes to give you a better idea of how to optimize queries (check out Dexter for automatic indexing)
PgHero 2.0 provides even more insight into your database performance with two additional features: query details and space stats.
Query Details
PgHero makes it easy to see the most time-consuming queries during a given time period, but it’s hard to follow an individual query’s performance over time. When you run into issues, it’s not always easy to uncover what happened. Are the top queries during an incident consistently the most time-consuming, or are they new? Did the number of calls increase or was it the average time?
The new Query Details page helps solve this.

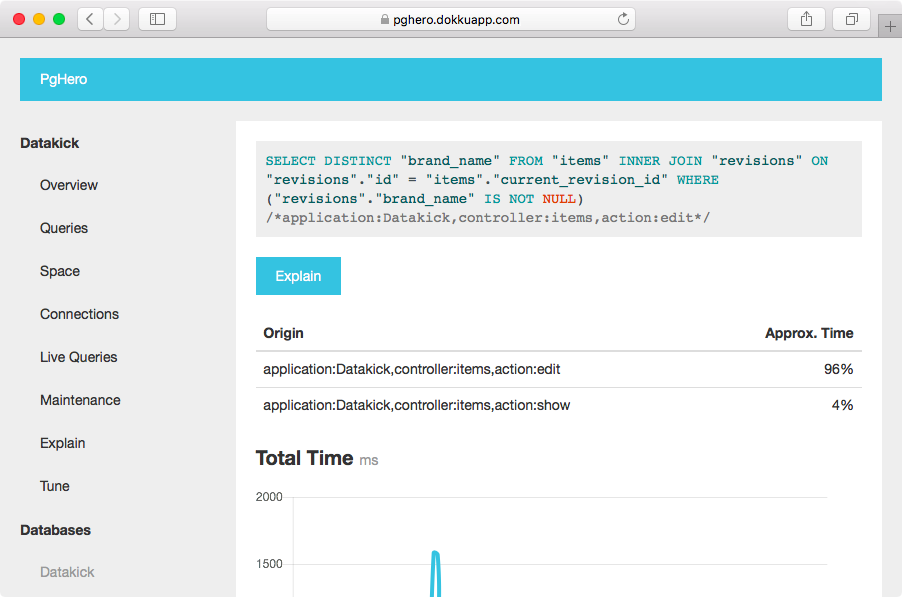
This page allows you to deep dive into an individual query. View charts of total time, average time, and calls over the past 24 hours to see how they’ve moved.
For those who annotate queries, you’ve likely realized the comment in PgHero only tells you one of the places a query is coming from since similar queries are grouped together. Now, you can get a better idea of all the places it’s called.
If you don’t annotate queries, you should!!
This page also lists tables in the query and their indexes so you can quickly see if an index is missing, and an “Explain” button is usually available to help you debug (but may be missing if PgHero hasn’t captured an unnormalized version of the query recently).
Space Stats
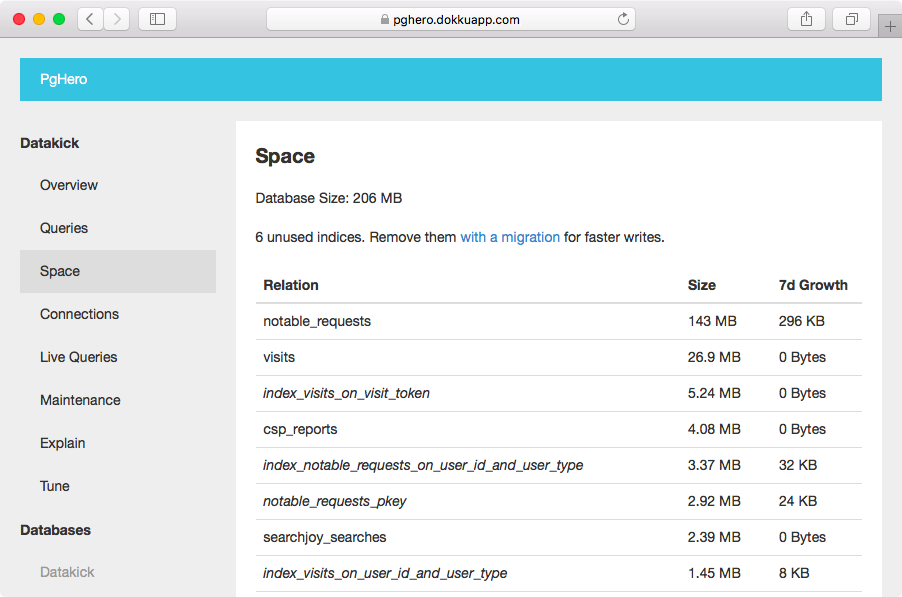
PgHero 2.0 also helps you manage storage space. You can track the growth of tables and indexes over time and view this data on the Space page. To see the fastest growing relations, click on the “7d Growth” header.

In addition, this page now reports unused indexes to help reclaim space. If you use read replicas, be sure to check that indexes aren’t used on any of them before dropping.
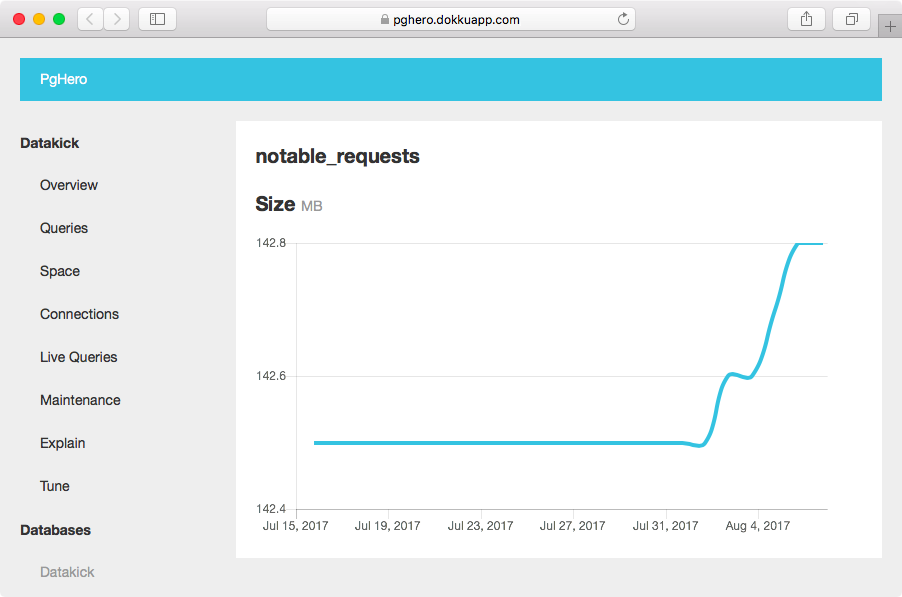
You can also view the growth for an individual table or index over the past 30 days.

Lastly, there’s syntax highlighting for all SQL for improved readability.

Much better :)
So what are you waiting for? Get the latest version of PgHero today.
Note: If you use PgHero outside the dashboard, there are some breaking changes from 1.x to be aware of.